The 3 Metrics That Changed My Financial Life
These are the three metrics that changed my financial life. That’s when something clicked: I didn’t need more hustle, or even more income—I needed tangible metrics. Not fuzzy feelings. Not guilt. Just numbers, clearly tracked, that could show me progress. Money used to stress me out. I’d check my bank app feeling a knot of anxiety, sometimes celebrating a nice deposit, more often just wondering: “Is this enough? Am I doing something wrong?” Everything felt vague, every choice weighed down by a sense of uncertainty. Then, one night during a mini money meltdown, I realized my fear wasn’t actually about money—it was about a total lack of clarity.
1. Savings Rate
Your savings rate is the single most powerful metric in your personal finance toolkit. It’s the percentage of your take-home pay that you keep instead of spend. Simple, right? But this number shapes your financial trajectory more than your income ever will.
Savings Rate = (Amount Saved This Month / Net Income This Month) × 100%
Why It Matters More Than Income
Two people can earn the same paycheck, but the one with a higher savings rate is building freedom far faster. A big salary can mask huge spending; a modest income, consistently saved, builds wealth.
Target ranges:
- Starter: 10–15%
- Good: 20–25%
- Ambitious: 30%+
This isn’t about judgment. Think of your savings rate as a KPI—a Key Performance Indicator. It’s just a signal, not a grade. Take a moment, calculate yours, and watch how the fog lifts.
2. Runway
Financial “runway” is the secret backbone behind every bold life decision I’ve made: launching a freelance project, taking a sabbatical, or simply weathering a storm.
Definition
Your runway is how many months you could live, at your current lifestyle, with the cash and accessible savings you have right now.
Runway (in months) = (Total Cash & Liquid Savings) / (Average Monthly Expenses)
3. Fixed Cost Ratio
Your fixed cost ratio is the less glamorous cousin of savings rate—but it’s just as important. This is the share of your income locked up in regular, recurring bills: rent/mortgage, utilities, insurance, subscriptions, car payments.
Fixed Cost Ratio = (Total Fixed Monthly Costs / Monthly Net Income) × 100%
Why High Fixed Costs = Trapped
The higher your fixed cost ratio, the tighter the straitjacket on your budget. When too much of your income is spoken for before the month even starts, flexibility disappears. It’s harder to react, change jobs, start a business, or adjust to surprises.
How to Reduce It (and Win Back Flexibility):
- Downsize housing or refinance loans when possible
- Cancel unused (or underused) subscriptions
- Shop around for better rates on insurance, phone, or utilities
- Be brutally honest about what you actually use and value
Every % you free up makes your money more nimble.
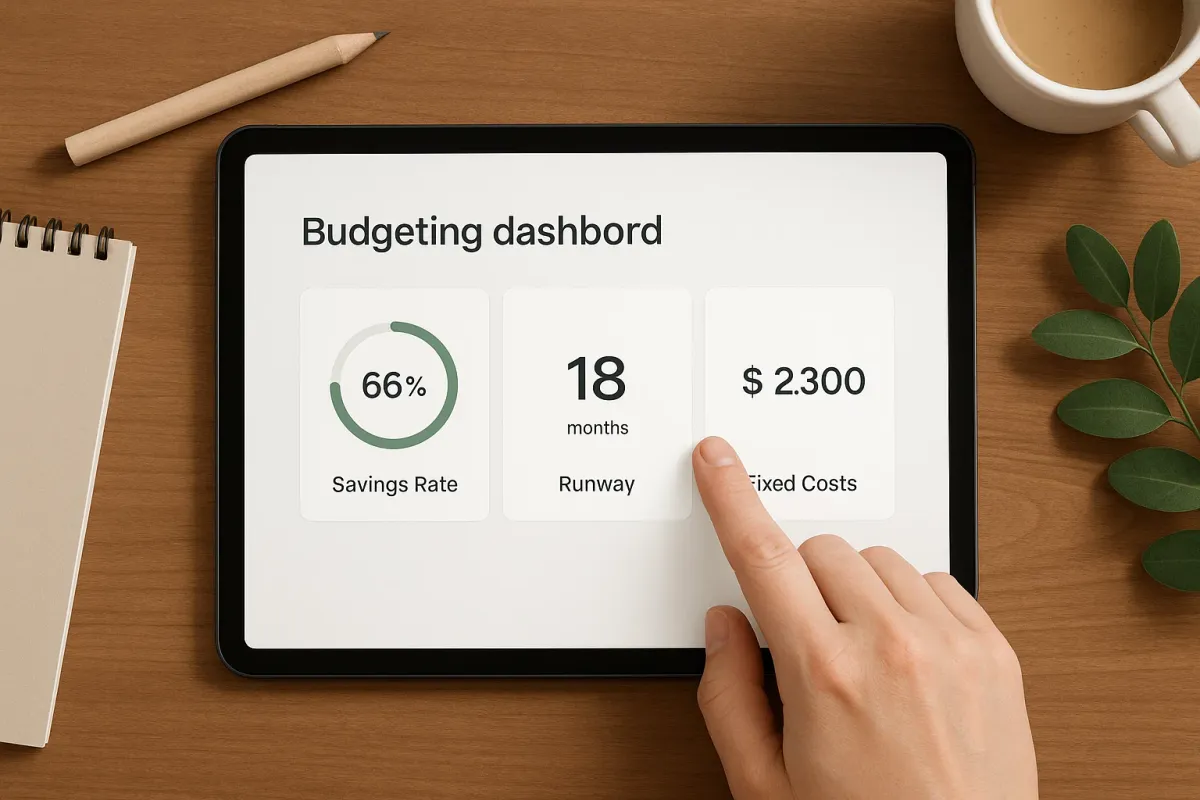
Visual Summary: The 3 Metrics Side by Side
Here’s how they compare:
How I Track These Metrics
(Without Fancy Apps)
I use a simple Google Sheet, updated at the end of each month. (Old-school, I know.)
- Three rows: Savings Rate, Runway, Fixed Cost Ratio.
- I keep receipts and bills in a folder for 30 minutes of “money time” once a month.
- No need for spreadsheets with macros, no paid apps, no integrations—just inputs and clarity.
The power is in the habit of checking in, not the complexity of the tool.
Philosophy: Metrics = Power
At the end of the day, my guiding principle is simple:
“Clarity isn’t control, but it leads to it.”
Numbers don’t tell you what to do—they show you where you are, so you can decide where to go next. Each metric is a compass point. Together, they shine a light on your financial path and hand you the map.
— Claire West
P.S. No affiliate links in this post. Tools mentioned are what I use myself.